JMeter GUI vs Non-GUI Mode: Where Each One Belongs
Use JMeter GUI mode for authoring and debugging, then move repeatable load to non-GUI execution with controlled data, listeners, and reporting.
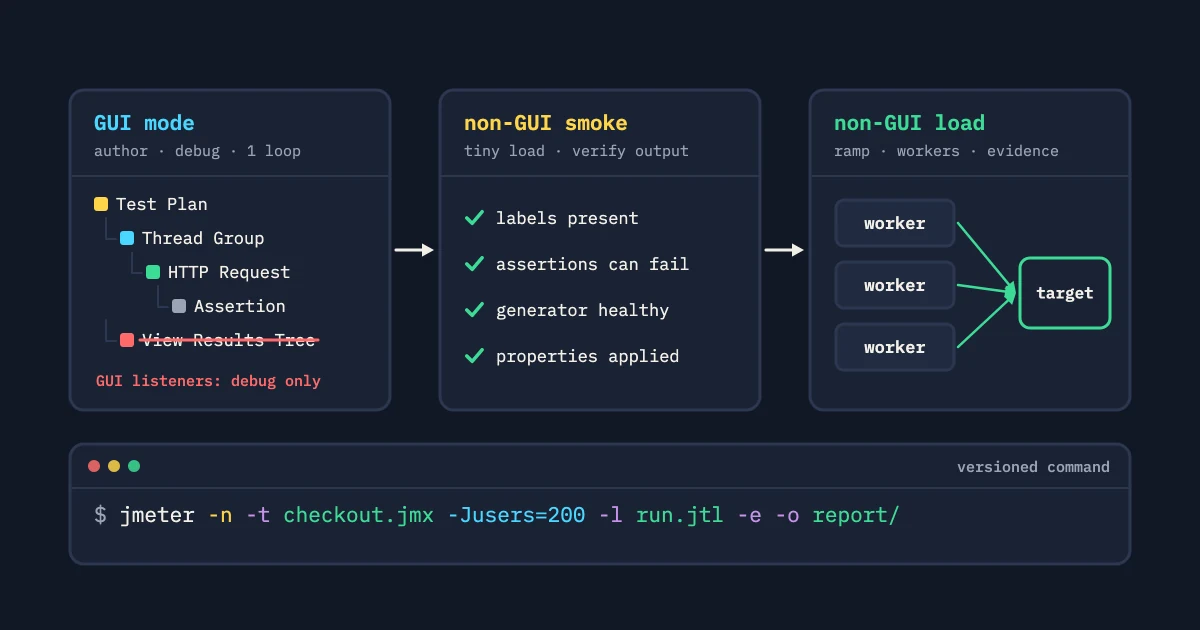
JMeter GUI mode is for building a test. Non-GUI mode is for running it. Mix up the two jobs and you get a test that behaves well on a laptop and badly when it matters.
Use the GUI to compose a plan, inspect samplers, debug variables, and review a small result. It carries visualization and listener overhead that has no place under sustained pressure. Non-GUI execution does two things: it generates the requested workload and writes the evidence you need afterward. A good workflow uses both, at different moments.
Author in the GUI with a small loop
Start with a narrow journey and a few iterations. Check the target URL, headers, authentication, extractors, assertions, timers, and cleanup. Keep only the listeners that help with the issue in front of you. A GUI session should answer “does this plan express the journey?” It should not try to answer “how much traffic can the service carry?”
Watch the request tree while you debug. A missing variable, redirect, or failed extractor often shows up there before it is visible in aggregate data. Add response assertions early. A green transport response does not prove the application returned the expected state.
Use representative data, and keep credentials out of it. Parameterize secrets and environment-specific origins. If the plan needs a token or ID from an earlier request, prove the extraction and reuse with a small loop. The correlation guide explains why you should treat dynamic values as dependencies, not pasted constants.
Remove visual weight before load
Listeners that render every sample use memory and CPU. Under load they compete with the engine for the same resources you are trying to measure. Take graphical listeners out of the load profile. Keep a result writer, or another output you chose on purpose, so the team can analyze the run afterward.
Review timers and assertions too. If you strip them out blindly, you change the workload or weaken correctness. Remove presentation overhead and keep validation. Keep the assertions that catch a bad response and the pacing that represents the user journey. Write down every intentional difference between the debug plan and the load plan.
A good handoff includes the JMX file, properties, data fixtures, engine version, command, and expected labels. If someone has to click through a desktop app to reproduce the run, the test is not ready to share as a performance artifact.
Run non-GUI as the default pressure path
Run the prepared plan from a clean environment with explicit properties. Put the test file, target configuration, users, ramp, duration, output location, and result format in the command or in a versioned wrapper. Do not rely on values hidden in a local GUI session. Another engineer should be able to review the same inputs and reproduce the run in CI or on a managed runner.
Before a large run, do a non-GUI smoke at low load. Check that the output has the expected labels, that assertions fail when you break them on purpose, and that the generator stays healthy. This catches path and property mistakes before they turn into an expensive run nobody can interpret.
JMeter’s non-GUI path is still a client. Watch its resource use and where it sits on the network. If it hits a CPU or connection ceiling, add workers or simplify the plan, but only in ways that keep the intended workload. Generator saturation is not a target capacity limit.
Keep results useful
Pick output that answers the question you wrote down at the start. For a release check, latency by label, error rate, assertion failures, throughput, and generator health may be enough. For a diagnosis, you may also need request timing components, response sizes, or server-side traces. More files do not mean more evidence.
Name labels the same way in GUI debugging and non-GUI runs. A grouped logical transaction makes a checkout journey easy to read. Sampler-level labels keep the detail you need for a slow dependency. Use both levels when the decision needs them. The JMeter engine guide helps keep that structure reviewable.
Do not make an open GUI part of a load-test recipe. You can use it to look into a result after the run. The pressure path must not depend on a desktop display, a local working directory, or a click nobody recorded.
A practical mode decision
Use GUI mode to author a new plan, check a request sequence, debug correlation, explore a response, or show someone the shape of a test. Use non-GUI mode to confirm a repeatable baseline, run sustained or distributed load, execute in CI, or collect evidence for a release decision.
The GUI has a place, and production-like pressure does not belong in it. Keep the authoring and debugging workbench apart from the repeatable engine, keep assertions and pacing, and make the handoff explicit.
Make the handoff reviewable
Start with a plan review that checks names, controllers, variables, assertions, and data-file references. Run the plan in the GUI only long enough to confirm the journey and inspect a failed response. Then run the same plan in non-GUI mode at tiny concurrency and compare labels and assertions. Add ramping, distributed workers, or longer durations only after that smoke repeats cleanly. Keep the command, JVM properties, data files, and output naming convention in the same review. This order catches a listener that changes resource use, a relative path that exists on one laptop only, or a property the GUI supplied without anyone noticing. The GUI stays useful for authoring. The scale path is the command another engineer can run in a clean workspace and explain from its output.
Before you schedule a larger test, have a second person run the non-GUI smoke from a clean checkout. Ask them to change one safe property, such as the target host or output directory, and check that the plan responds as expected. Review the result for labels, assertion outcomes, and timestamps. This catches a whole class of failures: a path that exists only on the author’s machine, a property name typed differently in the command, or a listener removed together with an assertion. A short review keeps the later run unambiguous.
Say a GUI plan shows a login sampler followed by a search sampler. The handoff should state whether the search token comes from the login response, whether the timer sits between the two, and which assertion proves authentication worked. The non-GUI command should expose those values as properties and leave a result that separates login failures from search failures. That detail beats a screenshot of a green tree, because it still holds on a different machine and in a later engine run.
The same review applies when you move a plan to a worker pool. Check that every worker gets the same properties and data files, that result labels stay identical, and that output paths do not overwrite each other. A distributed run should show its controller and worker assumptions before load starts. If you cannot say how the test collects its artifacts, stop at the smoke stage and fix the handoff. Otherwise you end up diagnosing an incomplete load as an application problem.
Record the exact JMeter and Java versions as part of that reproducibility contract.