Finding the Throughput Knee Before Your System Falls Over
Find the useful capacity boundary where latency accelerates and throughput flattens, before a dramatic crash makes the decision for you.
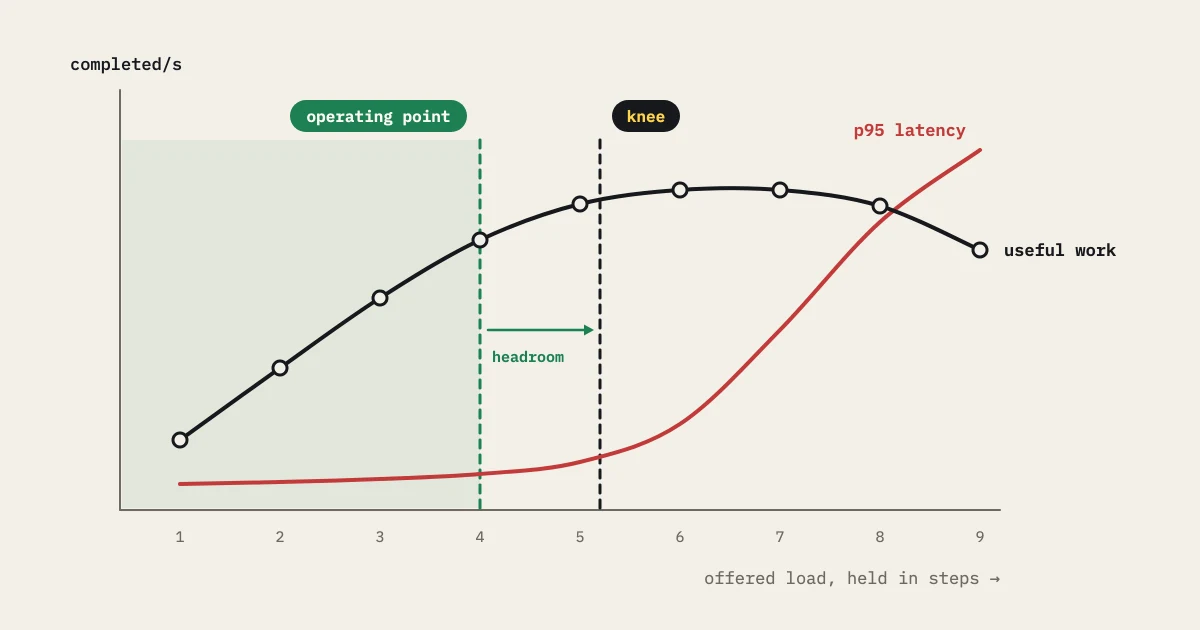
The dramatic crash point makes a poor capacity target. A system can already give customers a bad experience while it still returns responses, well before it refuses every request. The throughput knee is the operating boundary where more demand buys little extra useful work while latency and queueing speed up.
Define useful work
Pick a completion that matters: a successful checkout, a completed search, an acknowledged job, or a valid API transaction. Do not count fast errors as throughput. Count accepted, completed, rejected, retried, and failed work separately.
Define the timing boundary and the objective. A queue may acknowledge quickly while completion takes minutes, so plot both. Capacity belongs to a labeled journey and environment, not to a bare “requests per second” number.
Use stepped load
Start below the expected operating point. Raise arrivals or concurrency in steps. Hold each level long enough to see warm-up and steady behavior, and stop before you threaten safety limits. A smooth ramp can show a trend. Steps make it easier to tie a change to a mechanism.
At each step, record achieved useful throughput, p50/p95/p99, error and assertion rates, queue time, active work, generator health, and target saturation. Control cache state and data shape. If an autoscaler is in scope, give it time to react and mark the scale transition.
Recognize the shape
Before the knee, throughput often rises with demand and latency stays within its objective. Near the knee, throughput flattens, p95 stretches, queue depth grows, or a saturation signal turns nonlinear. Past it, retries and errors may climb while useful completions fall.
The shape can differ by journey. A read path may have one knee and a write path another. Segment by operation, status, payload, region, and dependency. A global average can hide the boundary that matters to the business.
Do not mistake a generator limit
Check scheduled and achieved workload, client CPU, sockets, bandwidth, event-loop delay, and whether workers agree. If the generator cannot reach the next step, the curve describes the client. Read the load-generator bottleneck guide before you name a target capacity.
Add workers only as a controlled experiment. Keep the artifact, data partition, location, and labels the same. A new location changes network behavior. A new connection policy changes the workload.
Explain the mechanism
Use target telemetry to link the knee to pool wait, locks, cache misses, queue workers, CPU throttling, storage I/O, or a dependency limit. The graph tells you where to look. A controlled change tells you whether the hypothesis explains the bend.
For example, if throughput flattens while database pool wait rises and application CPU stays moderate, test pool and query contention in a safe environment. If the database looks healthy but generator event-loop delay rises, suspect the client first. Keep inference apart from measured fact.
Choose an operating point
Set a capacity point below the knee, with headroom tied to the traffic scenario and its uncertainty. State whether the point applies per replica, per region, or to the whole service. Do not multiply it linearly across replicas when shared dependencies, locks, caches, or quotas make scaling nonlinear.
The capacity planning and traffic modeling guidance shows how to turn a tested point into a plan. Keep the stepped runs and comparisons, then give the decision an owner and a refresh trigger.
Repeat after change
Capacity does not stay fixed. Rerun after changes to architecture, data volume, dependencies, or autoscaling. Compare equivalent steps and note the differences. Keep the old curve. A new knee is evidence even when the current release passes.
You are looking for the boundary where users start paying for extra demand, not for the loudest failure. Find it, then leave enough room that normal uncertainty does not cross it.
A capacity decision record
Write down the chosen operating point, the load steps before and after it, the workload achieved, and the evidence for the knee. Explain the headroom: forecast uncertainty, autoscaler delay, dependency budget, and the cost of a false positive or false negative. If the point is per replica, document the shared limits that rule out simple multiplication.
Set a refresh trigger, such as a data-volume change, a dependency upgrade, a topology change, or sustained traffic growth. The knee is an observation under stated conditions. Treating it as a permanent product limit misleads as much as treating a crash point as safe capacity.
Include recovery after the final load level. Reduce arrivals, watch the queue drain, check that errors return to baseline, and confirm fixtures and caches are in the expected state. A knee found while a queue is still unrecovered cannot be compared with a fresh run.
Use a table even when the chart looks clear: load step, scheduled and achieved work, p95, error rate, queue age, and saturation. Mark the first step where useful throughput stops increasing. A reviewer can then check the operating-point recommendation, and you avoid picking a knee from an underloaded chart.
If the knee is ambiguous, name the next experiment in the recommendation. That is better engineering than forcing one exact boundary out of incomplete evidence.
Turn the curve into an operating policy
Repeat the suspected operating point with the same scenario mix, fixture partition, cache preparation, and dependency mode. A knee that appears only after one expensive operation becomes more common may reflect a change in workload shape, not a general capacity boundary. Compare completed work, queue age, latency distribution, errors, and resource saturation together. If throughput flattens while queue age grows, treat the system as nearing a service limit even if CPU has room, because another resource may be serialized or waiting. If throughput falls while the generator is saturated, the result describes the test setup. Mark the selected operating point provisional until a second run supports it, and state the headroom policy that keeps normal traffic below the boundary. A striking curve then becomes a defensible operational choice, with a clear experiment for when the architecture or traffic mix changes.
A capacity curve earns its keep when it drives a policy. Define the normal operating range, the warning range, and the action you take when demand nears the boundary. For example, a service may run below the measured knee, alert when queue age nears the warning range, and shed or defer work before the hard limit. The test does not pick those values alone. Product impact, recovery time, and dependency budgets belong in the decision.
Handle uncertainty explicitly. Repeat the boundary with a second fixture partition, cache condition, or worker placement, and compare the first-order signals instead of averaging them into one optimistic point. If the knee moves a lot, publish a range and use the lower safe bound until you understand the cause. If the curves agree, you can narrow the range around the operating point, but keep the repeated evidence and its conditions.
Translate the result into capacity units an operator can act on. State useful transactions per second, active sessions or queue producers, required worker count, database pool headroom, and expected recovery behavior. Do not multiply a small run’s throughput linearly when a shared dependency or fixed quota is already close to saturation. Name the scaling assumption and the experiment that would validate it.
Add a change trigger. Rerun after a change to a dependency, data volume, cache, executor, or architecture, and before a known demand event. Keep the previous curve as a baseline with the same workload labels. A future result that moves the knee left is an early warning even if the service still passes its hard threshold. A result that moves it right counts only when correctness and recovery hold.
The final record answers four questions. What useful work did the system sustain? Where did marginal capacity deteriorate? What safety margin did you choose? What evidence would invalidate that choice? With those answers, a performance graph becomes an operating agreement instead of a one-time peak number.
For a concrete decision, say two adjacent steps sustain similar completed work but the later step doubles queue age. Pick the earlier step as the provisional ceiling, repeat it with a fresh partition, and alert before that queue age is reached. If the repeat differs, publish a bounded range and investigate the shared resource instead of claiming a precise knee.
Keep that reasoning visible.
Revisit the provisional ceiling whenever traffic mix, dependency behavior, or data volume changes enough to alter the curve’s shape.